1.2 KiB
1.2 KiB
Ch14 lab
Setup
Deploy the monitoring subsystem:
kubectl apply -f lab/monitoring/
Browse to the Prometheus UI - there are no targets
Sample Solution
This is the background info:
-
Prometheus is configured to find targets in the namespace
kiamol-ch14-lab -
all exporters are listed on the Prometheus docs
-
the Elasticsearch exporter exposes metrics on port 9114.
My solution is in elasticsearch.yaml.
Create the namespace and deploy the app:
kubectl create ns kiamol-ch14-lab

kubectl apply -f lab/elasticsearch.yml -n kiamol-ch14-lab
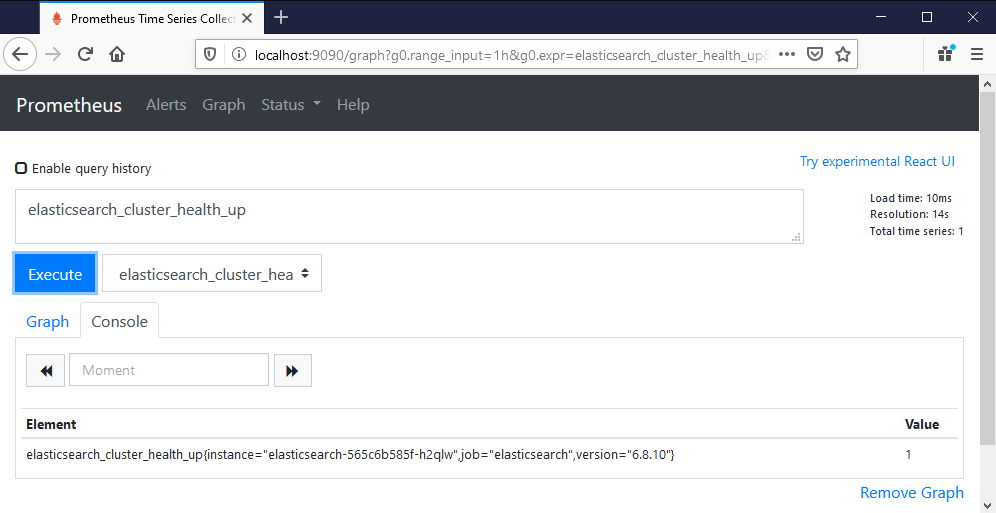
Back in Prometheus you'll see the target added, with about 300 new metrics
elasticsearch_cluster_health_up is the most basic, it should return 1 and show the version info in the labels:
Teardown
Remove the namespaces and that removes everything:
kubectl delete ns kiamol-ch14-lab

kubectl delete ns kiamol-ch14-lab-monitoring